


1.0 Background and motivation
Despite the fact that many research have been conducted in the past on factors impacting life expectancy, including demographic characteristics, income composition, and mortality rates, Max Roser emphasized on Our World In Data that the influence of vaccines has been overlooked (Max et al 2013). Share the same concern with Max, two researchers from World Health Organization (WHO) Department of Data and Analytics, Deeksha Russell and Duan Wang, have compiled a collection of statistics on the key drivers of life expectancy, with a focus on immunization variables including Hepatitis B, Measles, Polio, and Diphtheria (Deeksha and Duan 2015). Furthermore, mortality, economy, social issues, and other health- related aspects are all taken into consideration (Deeksha and Duan 2015). As a result, numerous analyses of the impact of vaccination on human lifespans in developed and developing nations have been undertaken using this data set, with the goal of assisting residents in those countries in improving their quality of life.
2.0 Objectives
The analysis tries to answer the following essential questions:
- - Among four main categories: vaccination-related factors, mortality-related factors, economic factors, and social factors, what are the actual factors influencing life expectancy?
- - What effect does immunization coverage have on life expectancy?
- - What effect do schooling and alcohol have on life expectancy?
- - What effect does GDP have on life expectancy?
3.0 Tools Used
4.0 Data Cleaning Process
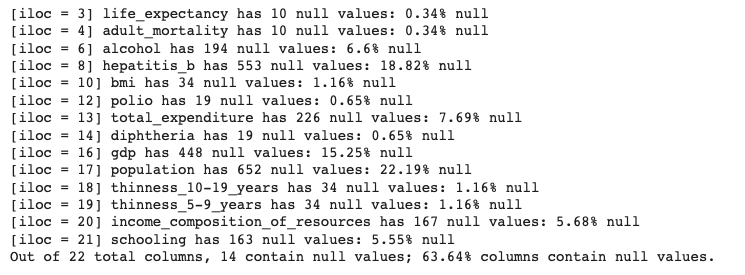
4.1 Detecting and Handling missing values
Detecting missing values.
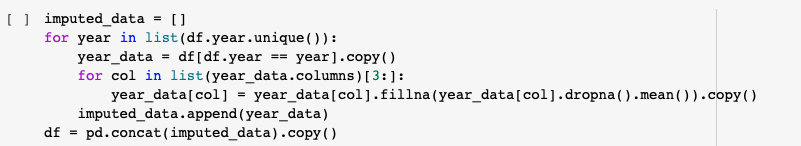
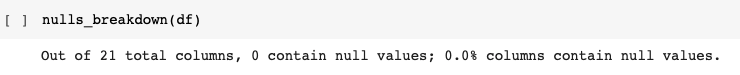
Dealing with Missing values.
Using the mean (average) value of the year to replace missing values.
4.2 Detecting and Handling outliers
Checking Data Distribution with Histogram and Box Plots
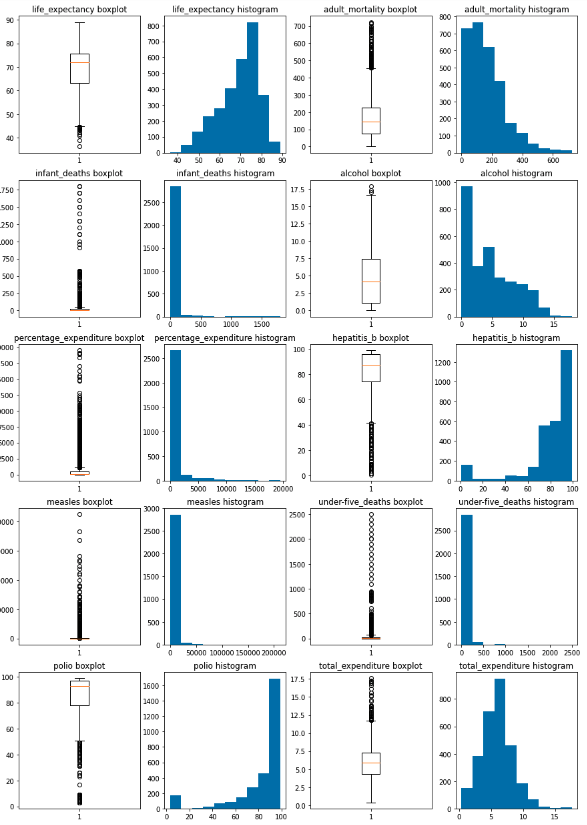
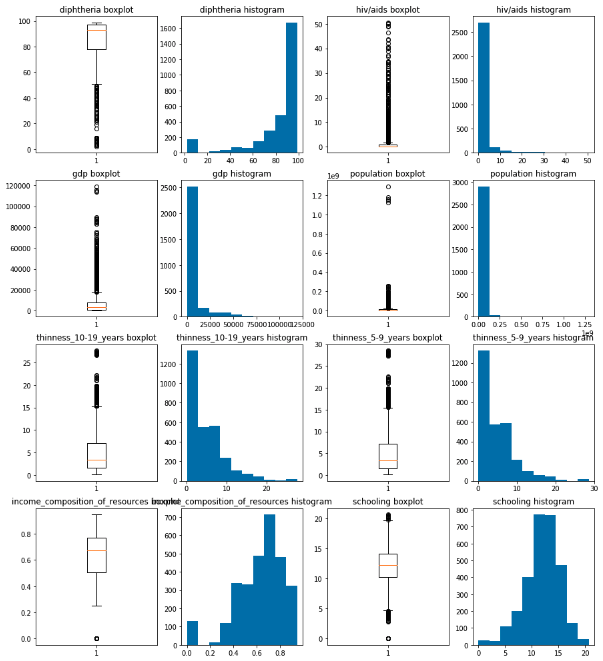
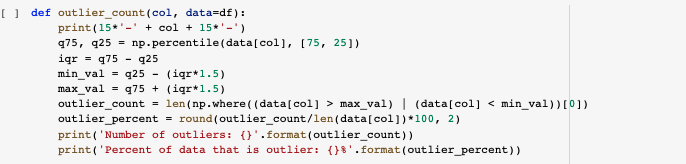
Retrieving outliers’ data with IQR score
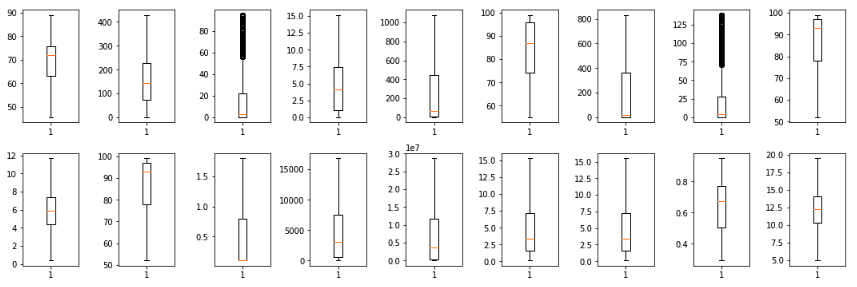
Dealing with outliers
The Winsorizing approach proposed by Tukey & McLaughlin (1963) is suggested in this project to handle the outliers. An ideal approach is setting all outliers to a specific percentage of the data, for example, all data above the 95th percentile are recoded to the 95th percentile value, and all observations below the 5th percentile are recoded to 25th percentile value (Tukey & McLaughlin 1963).

5.0 Data Visualization
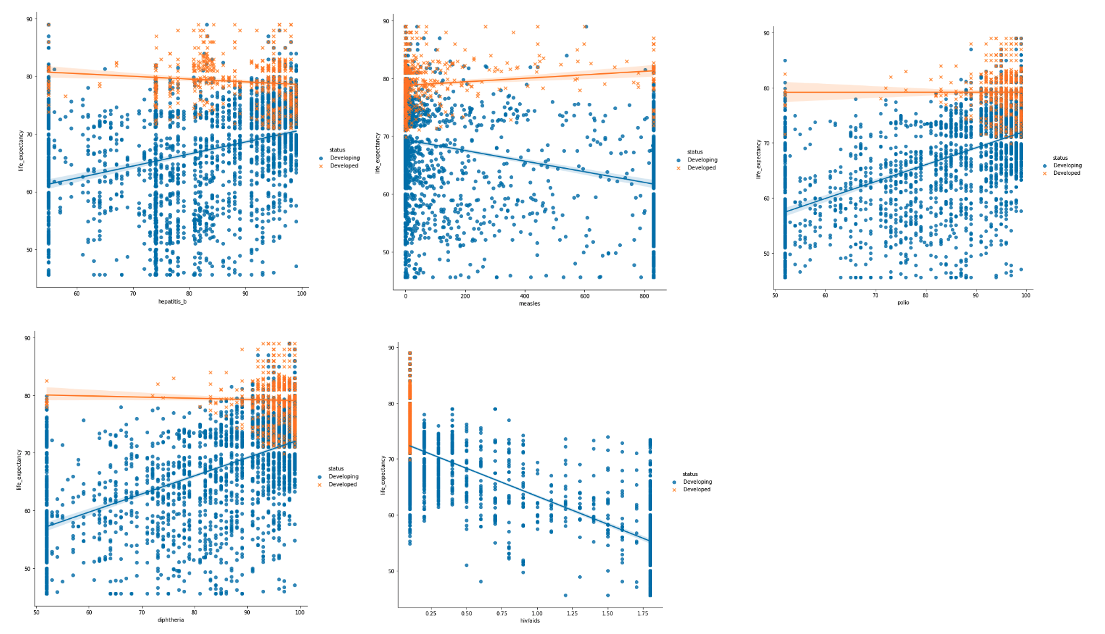
Question 1: What are the actual factors influencing life expectancy?
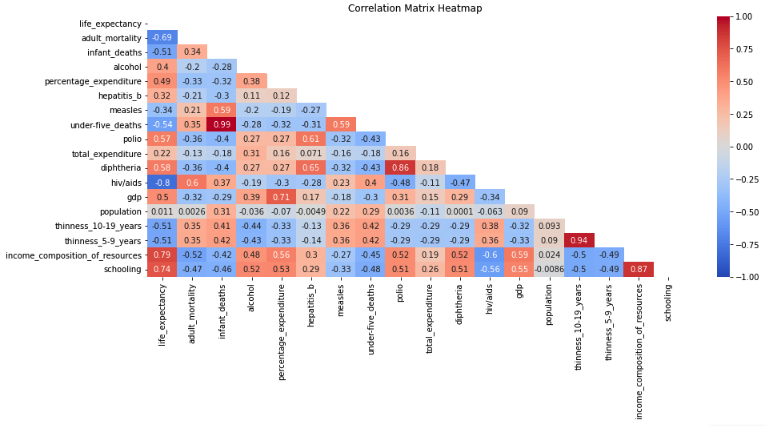
- - There is no significant correlation between life expectancy and population.
- - The factors have positive correlation with life expectancy: alcohol, percentage expenditure, hepatitis B, polio, total expenditure, diphtheria, GDP, income composition of resources, schooling.
- - The factors have negative correlation with life expectancy: adult mortality, infant deaths, measles, under five deaths, HIV/AIDS, thinnes 10-19 years, thinnes 5-9 years.
Question 3: What effect does Schooling and Alcohol have on Life Expectancy?
- - It is clear that education has a greater impact on boosting lifespan in developing nations than in developed countries. The analysis on HIV/AIDS above can be seen as a typical example, when the number of people attending school increases, it can assist to reduce the mortality rate from the HIV virus. Education has a positive impact on enhancing life expectancy in wealthy nations as well, however since these countries have been investing in education for a long time, the improvement is not as noticeable as it is in developing ones.
- - Because industrialised countries can produce and distribute alcohol domestically at a low cost, the amount of alcohol consumed in developed nations is larger than in developing countries. As a consequence, there is a negative correlation between alcohol consumption and life expectancy in wealthy countries. The more individuals who drink alcohol, the shorter their life expectancy becomes. On the other hand in developing countries, because alcohol is expensive and not accessible to everyone, there are fewer drinkers than in developed ones (Charles 2015). Due to that, the data is insufficient for analysis. The alcohol scatters plot above does not imply that in developing nations, alcohol consumption and life expectancy have a positive correlation.
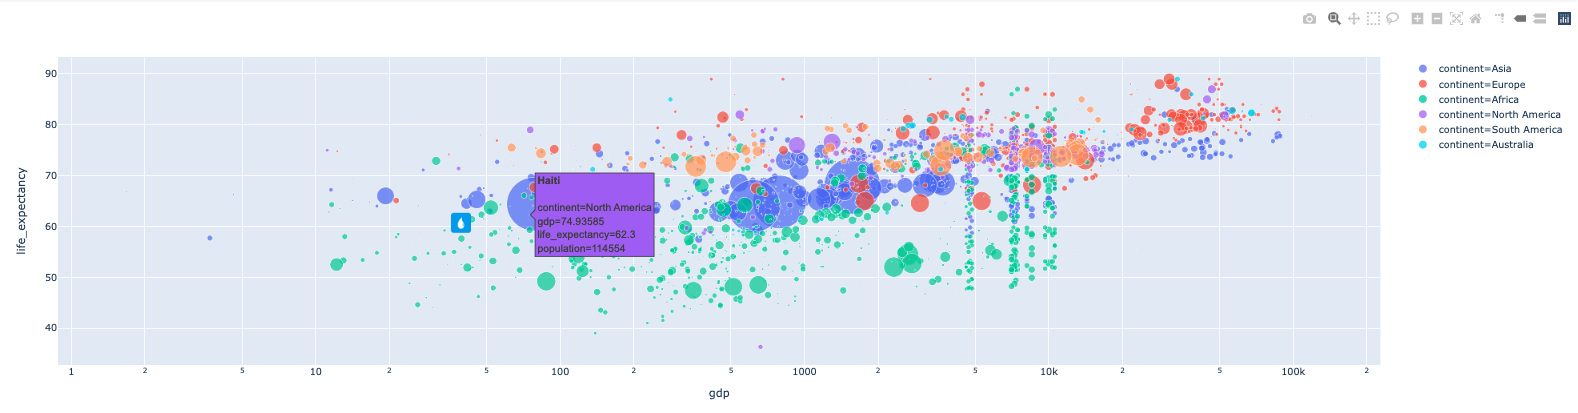
Question 4: What effect does GDP have on life expectancy?
6.0 Conclusion
- 1. The World Health Organization's data set on variables impacting life expectancy still has a lot of missing numbers. These missing data values are primarily seen in nations with small populations, where data sources are not abundant.
- 2. This dataset also contains numerous outliers that have been reprocessed using the Winsorization approach.
- 3. Many developing countries are doing a good job of promoting vaccination against hepatitis B, polio, and diphtheria among 1-year-old children in order to improve the life expectancy of their citizens. However, the availability of the measles vaccine still needs to improve because they is one of the most dangerous causes of the recent life expectancy declines.
- 4. One of the diseases that has a substantial influence on life expectancy in underdeveloped countries is HIV/AIDS. This directly highlights the important role of education in resolving this issue. If the number of people in developing countries who go to school increases, so does the number of HIV/AIDS infections and the mortality rate by HIV/AIDS will reduced. As a result, life expectancy possibly rises.
- 5. Furthermore, Alcohol intake is a severe problem in industrialised countries, with a detrimental influence on life expectancy. When the amount of alcohol consumed gets out of control (Centers for Disease Control and Prevention 2015), it has a negative impact on health, which in turn is a decrease in life expectancy.