

1.0 Project Overview
Diabetes, according to the World Health Organization, is a chronic disease that occurs when blood glucose levels are abnormally high, posing a risk to several body organs such as the heart, eyes, kidneys, and lungs (World Health Organization 2020). There is currently no cure for diabetes, but it is possible to predict an individual's likelihood of developing the disease using medical indicators such as blood pressure, glucose levels, insulin levels and genetics.
Recognizing the importance of early diabetes diagnosis, this project utilised the Pima Indians diabetic dataset from the machine learning repository at the University of California, Irvine to develop a supervised classification machine learning model. Through the application of data science, this initiative aims to assist medical practitioners in increasing the life expectancy of women in the community.
2.0 Tools Used
3.0 Data preprocessing process
3.1 Handling Null data by approriate Mean and Median values
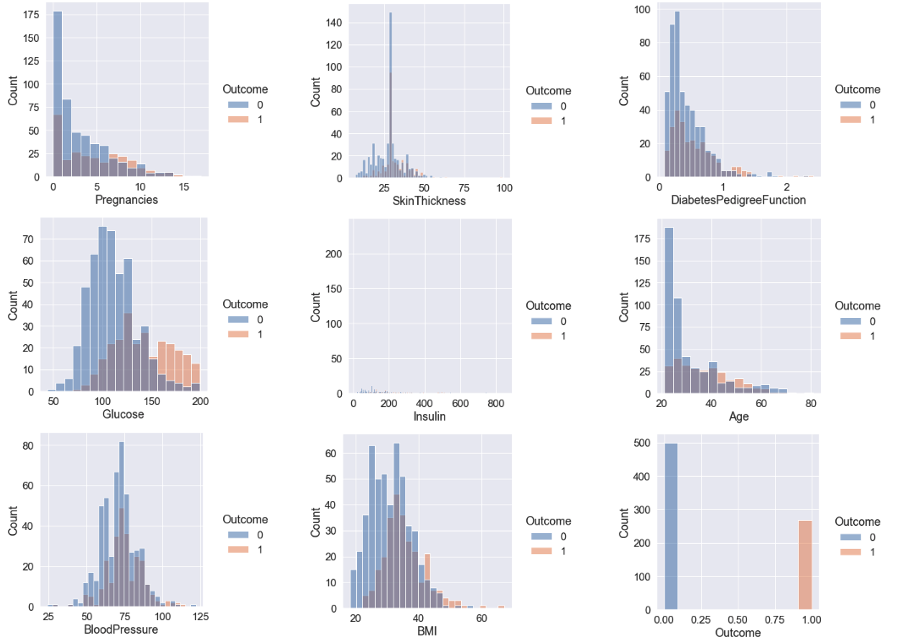
Checking data distribution by histogram
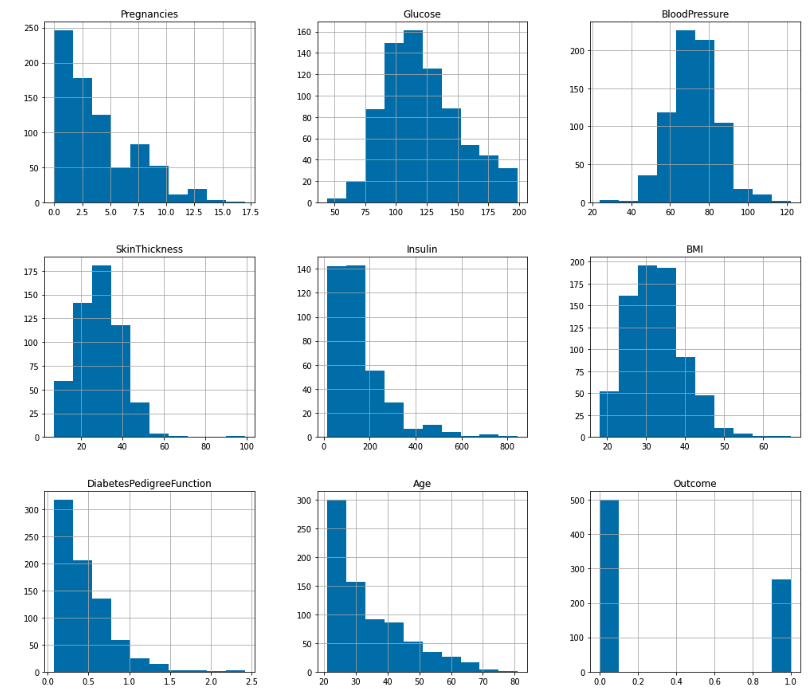
- - The histogram above indicates that Glucose and BloodPressure have roughly normal distributions; hence, null values in these columns can be replaced with the MEAN.
- - For Insulin, SkinThickness, and BMI, the data skew to the left is excessively pronounced; hence, the MEDIAN should be used to replace null values.
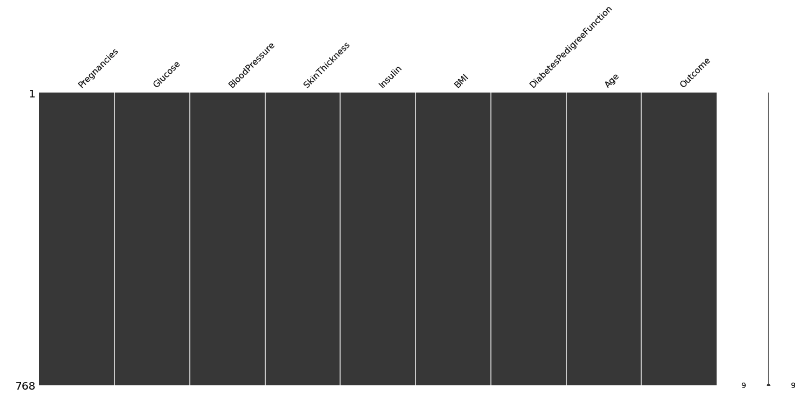
The project data set no longer contains missing values.
3.2 Detect Outliers
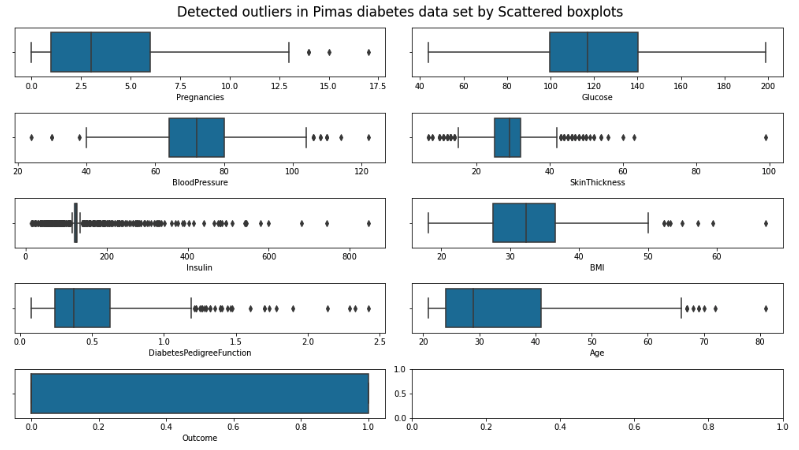
- - Insulin, DiabetesPedigreeFunction, and SkinThickness are the features with the greatest number of outliers among the eight independent columns.
- - Outliers can influence the accuracy of several classification models, such as KNN and Logistic Regression, hence they will be preserved.
3.3 Conclusion
- - It no longer contains missing value.
- - It has been decided to keep outliers.
4.0 Data Exploration
4.1 Explore distribution of Non-Diabetic (0) and Diabetes (1) data in each independent parameter
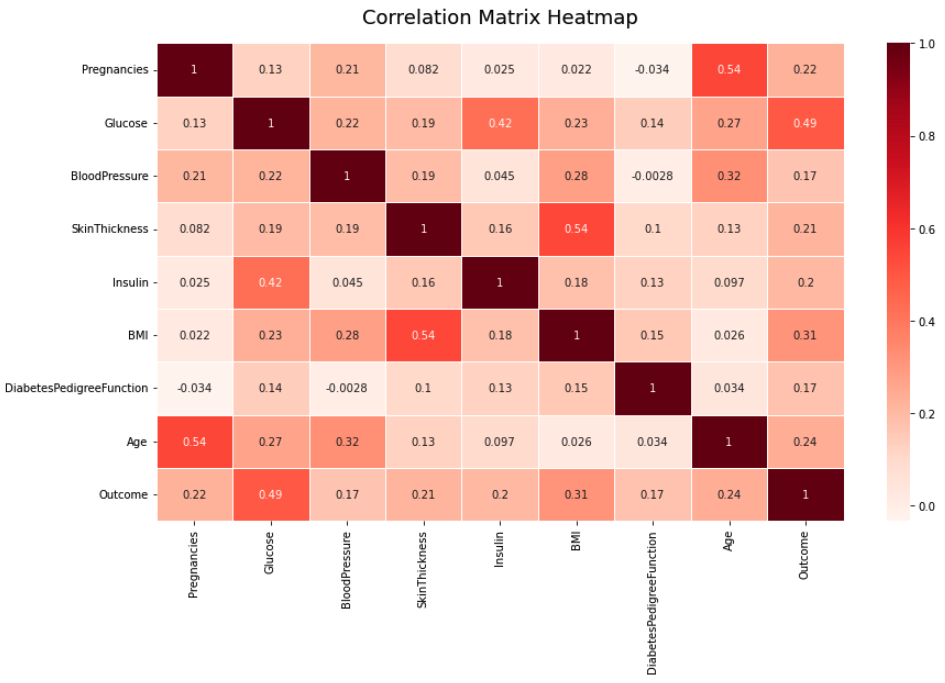
4.2 Explore relationship between features
4.3 Formulate Hypothesis
4.3.1 Which variables increase the likelihood of diabetes in women?
- - In terms of Glucose: As explained by Australia Department of Health, during the process of eating, a portion of the food's sugar is absorbed by the human body. If this amount of sugar is not metabolised and instead builds up excessively in the blood, a situation known as hyperglycemia develops, leading to diabetes (Australia Government - Department of Health 2019).
- - In terms of Body Max Index (BMI): As the level of fat in the body increases, tissues and cells become more resistant and limit the production of the hormone insulin, hence increasing the risk of diabetes (Diabetes Australia 2020). This is evident from the BMI displot illustrated in section 2.1, which classifies women with a BMI 25-29.9 𝑘𝑔/𝑚2 as "overweight" or "pre-obese", with a BMI 30.0-34.9 𝑘𝑔/𝑚2 as "obesity class 1", with a BMI 35.0-39.9 𝑘𝑔/𝑚2 as "obesity class 2", and with a BMI 40 𝑘𝑔/𝑚2 or more as "severe obesity" (Diabetes Australia 2020). All individuals in these high BMI groups were diagnosed with diabetes.
- - In terms of Diabetes Pedigree Function: People with a family history of diabetes, especially a parent, are more likely to inherit the diabetes-causing genes (Diabetes Australia 2020).
- - In terms of Age: As people get older, their cells become insulin-resistant and the pancreas produces less insulin than when they were younger. Consequently, diabetes is common among the elderly (Diabetes Australia 2020).
- - In terms of Pregnancies: During pregnancy, the placenta produces a hormone that aids in the development of the foetus but restricts insulin production by the pancreas. Moreover, the blood glucose levels of pregnant women are frequently high, and they gain weight as well. This results in gestational diabetes, a form of diabetes that occurs during pregnancy. After a woman is diagnosed with gestational diabetes, the risk of having diabetes later in her life is extremely high (Diabetes Australia 2020).
On the other hand, blood pressure, insulin, and skin thickness also affect the likelihood of developing diabetes, but not significantly.
4.3.2 How does pregnancy cause detrimental effects to women clinical parameters?
- - Insulin, Skin Thickness, and Diabetes Pedigree Function all correlate negatively with Pregnancies. In particular, during pregnancy, insulin levels in female's body frequently decline because of a hormone generated by the placenta. Additionally, as the size of the foetus increases, the skin of pregnant women grows thinner. The more the number of pregnancies a woman has, the less elastic her skin gets (Australia Government - Department of Health 2019).
- - Furthermore, as previously mentioned, some women do not have diabetes before they get pregnant; they develop gestational diabetes only during pregnancy, and the majority of these women return to being nondiabetic after giving birth (Diabetes Australia 2020). Therefore, the inverse correlation between Pregnancies and Diabetes Pedigree Function implies that not all examined women in the Pima diabetes data set contain the hereditary diabetes gene.
5.0 Data Modelling
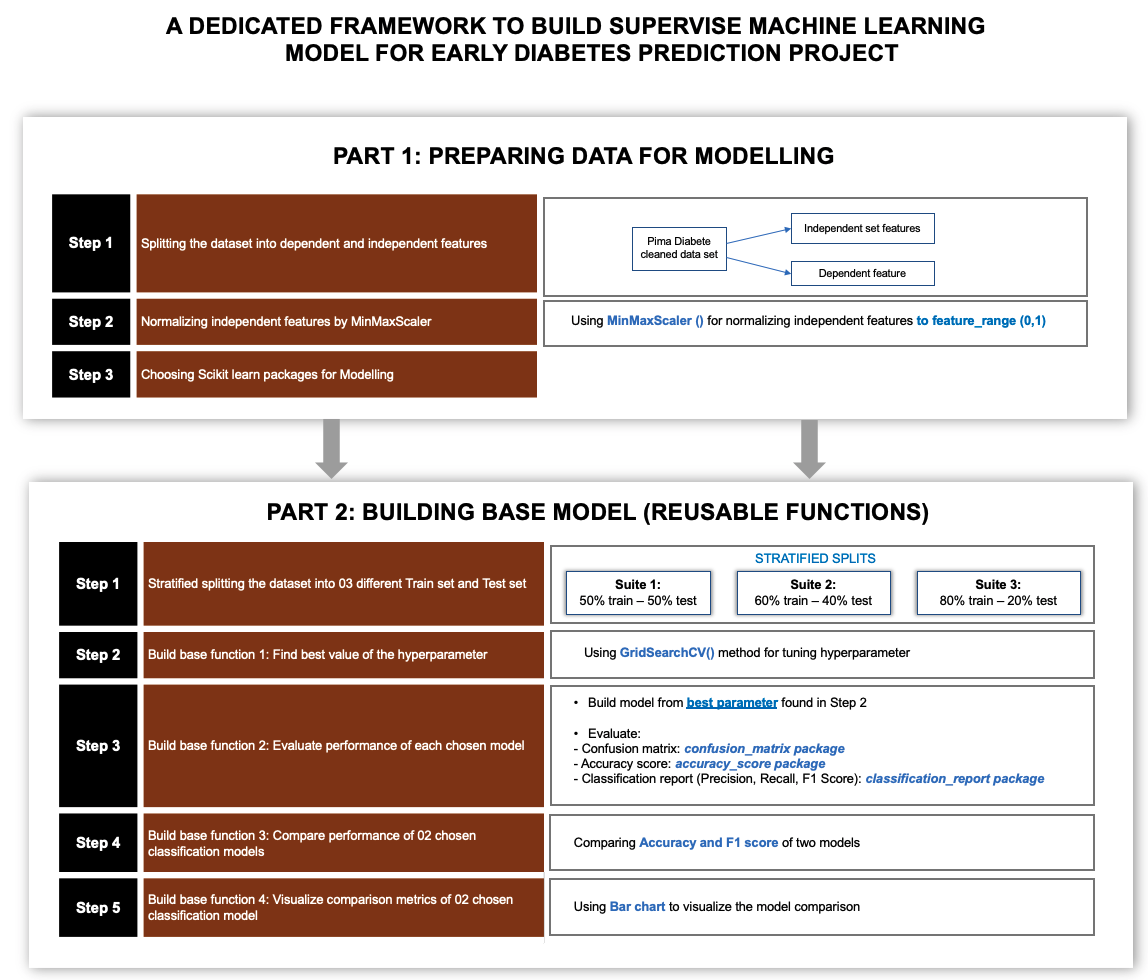
5.1 Building Base Models (Reusable functions) for repeated tasks
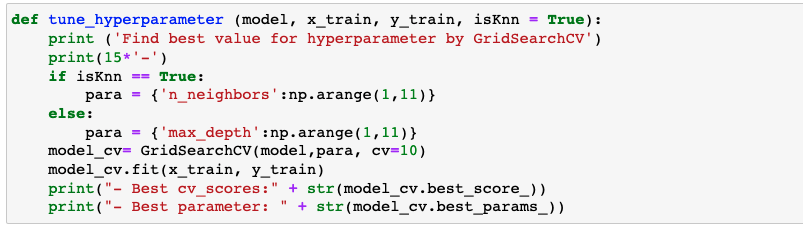
5.1.1 Base function to find best value of the hyperparameter
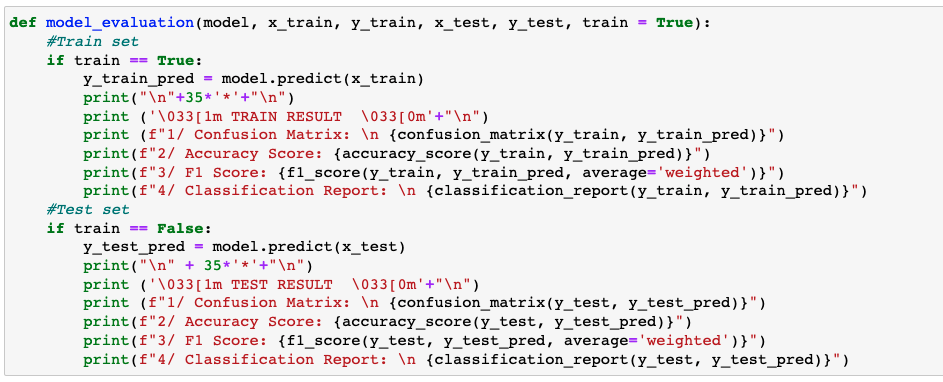
5.1.2 Base function to evaluate performance of each chosen classification model
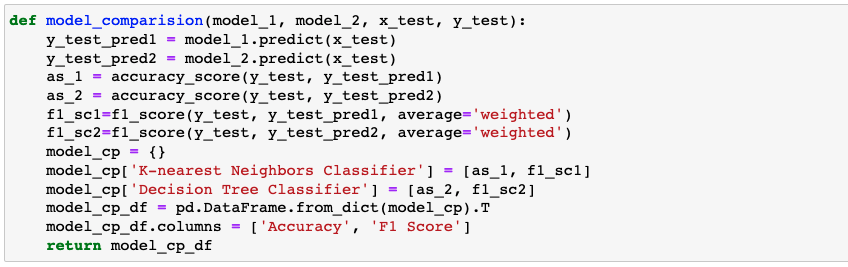
5.1.3 Base function to compare performance of 02 chosen classification models
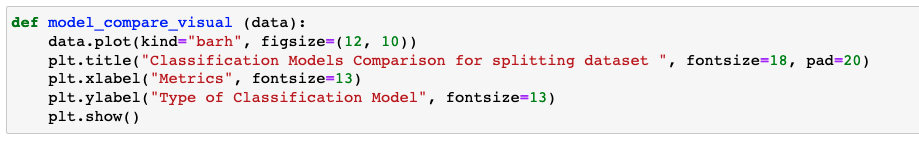
5.1.4 Base function to visualize comparison metrics of 02 chosen classification model
5.2 Applying Base model for data partitioning: 80% for training and 20% for testing
5.2.1 Model 1: K-nearest Neighbors Algorithm
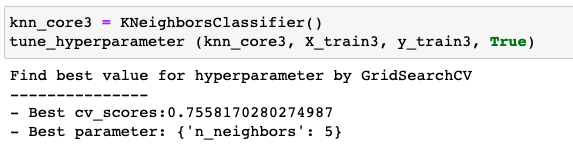
Find best value of the hyperparameter "n_neighbors"
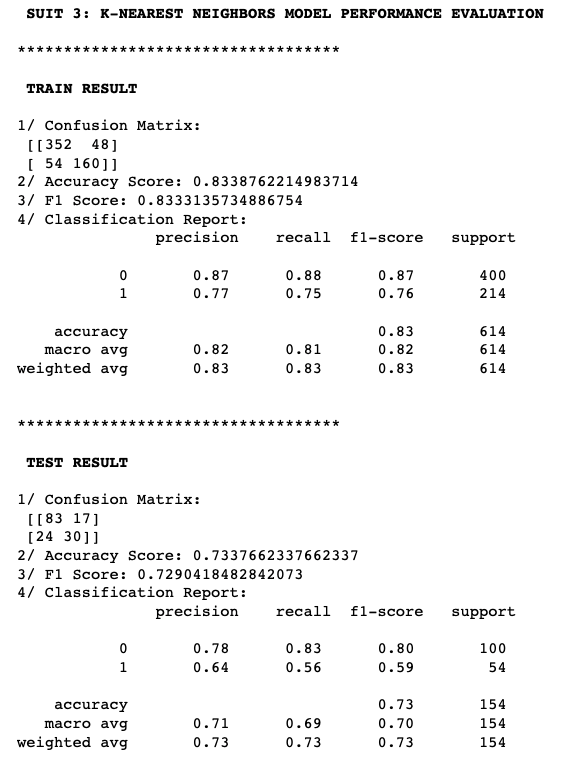
Evaluate K-nearest Neighbors Algorithm Performance
5.2.2 Model 2: Decision Tree Algorithm
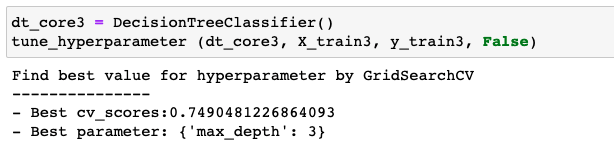
Find best value of the hyperparameter "max_depth"
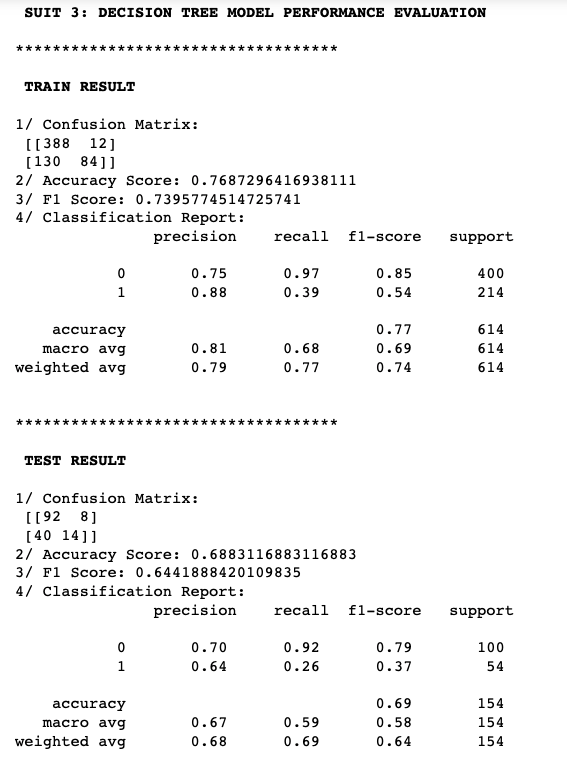
Evaluate Decision Tree Algorithm Performance
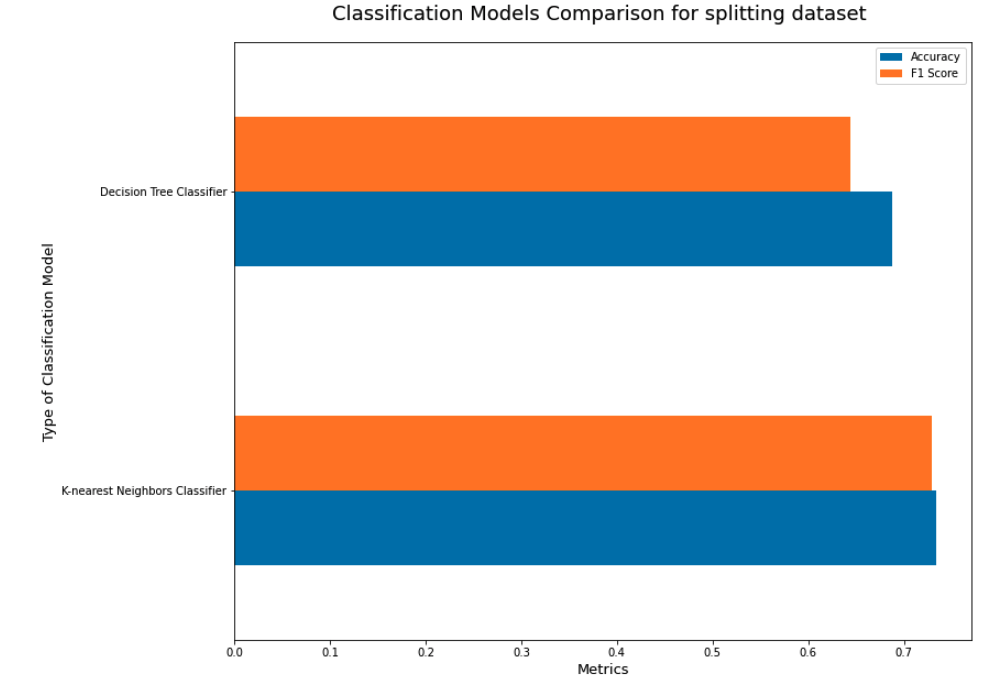
6.0 Models comparison
Comparing metrics approach

Visualizing performance's difference between 02 models