


1.0 Project Overview
Autonomous vehicles receive pixel-by-pixel sensor data from RGB cameras, point-by-point depth information from the cameras, and sensor data as input [2, 3]. The internal computer of a vehicle with Autonomous Driving processes the input data and generates the desired output, such as steering angle, torque, and brake [2, 3].
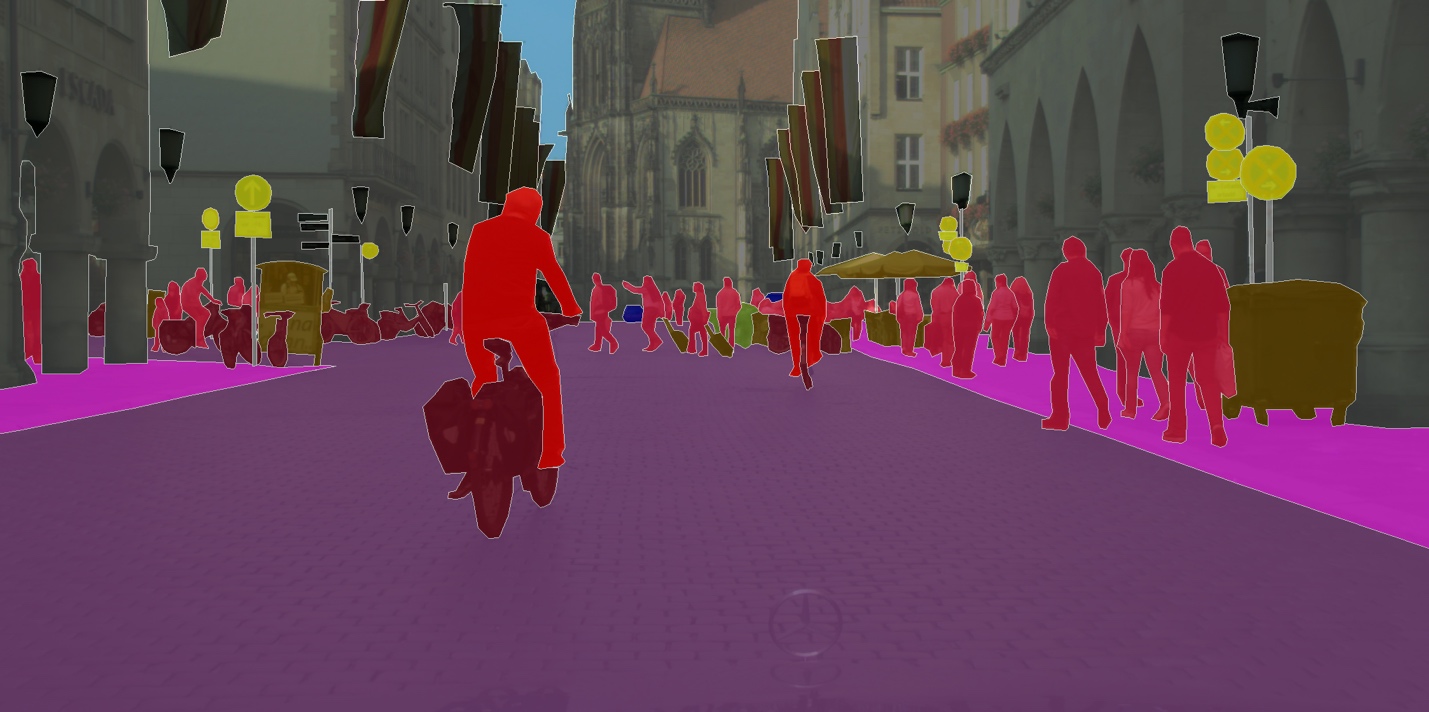
For the vehicle's computer to make an accurate decision, it must be completely aware of its surroundings and comprehend each pixel in the driving scene [2]. Semantic Segmentation is the assignment of a class label (such as Car, Road, Pedestrian, or Sky) to every pixel in an image [2, 3]. A superior algorithm for semantic segmentation will contribute to the development of autonomous driving.
2.0 Project Objectives and Scopes
After studying certain deep learning frameworks, I plan to apply this knowledge to the CityScapes dataset (https://www.cityscapes-dataset.com/) in order to accomplish the unit's two primary objectives:
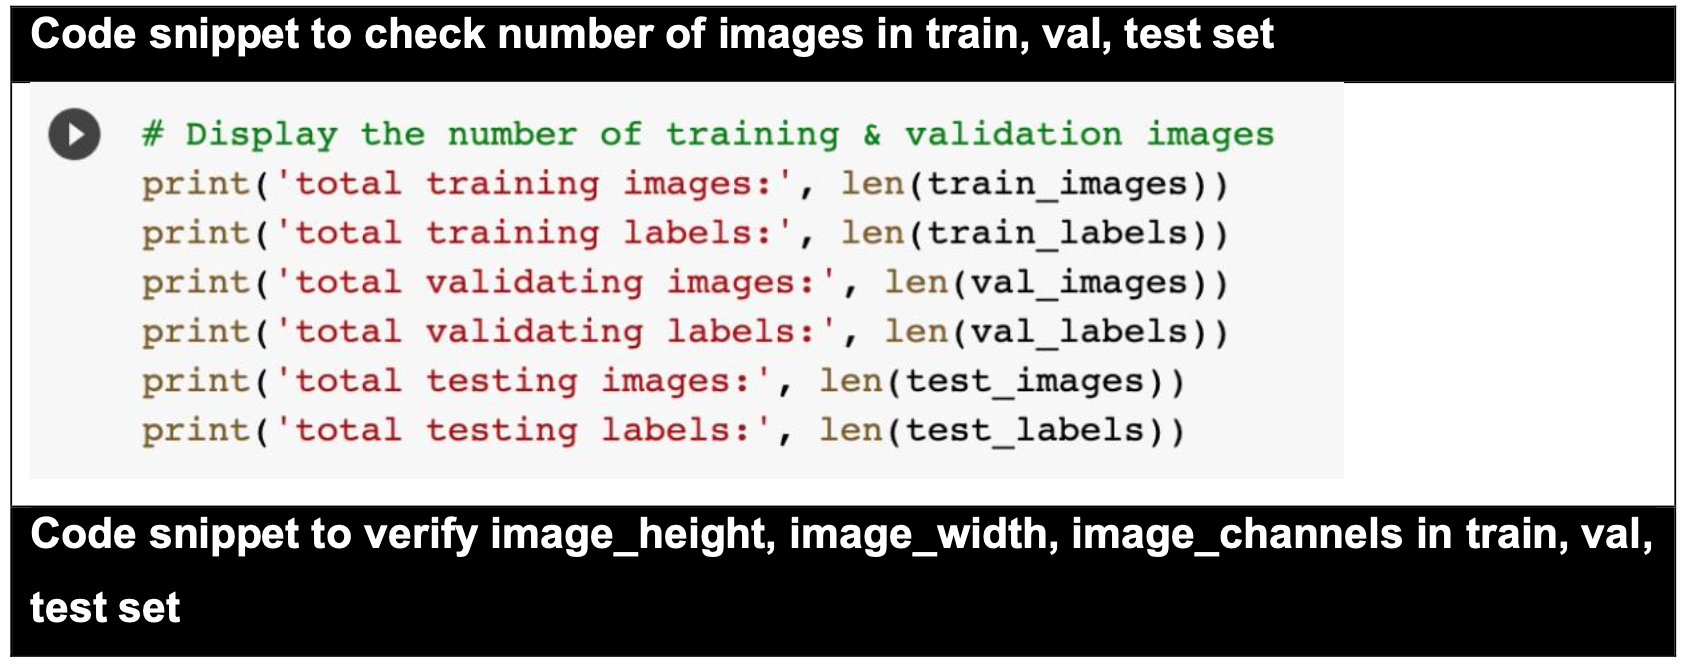
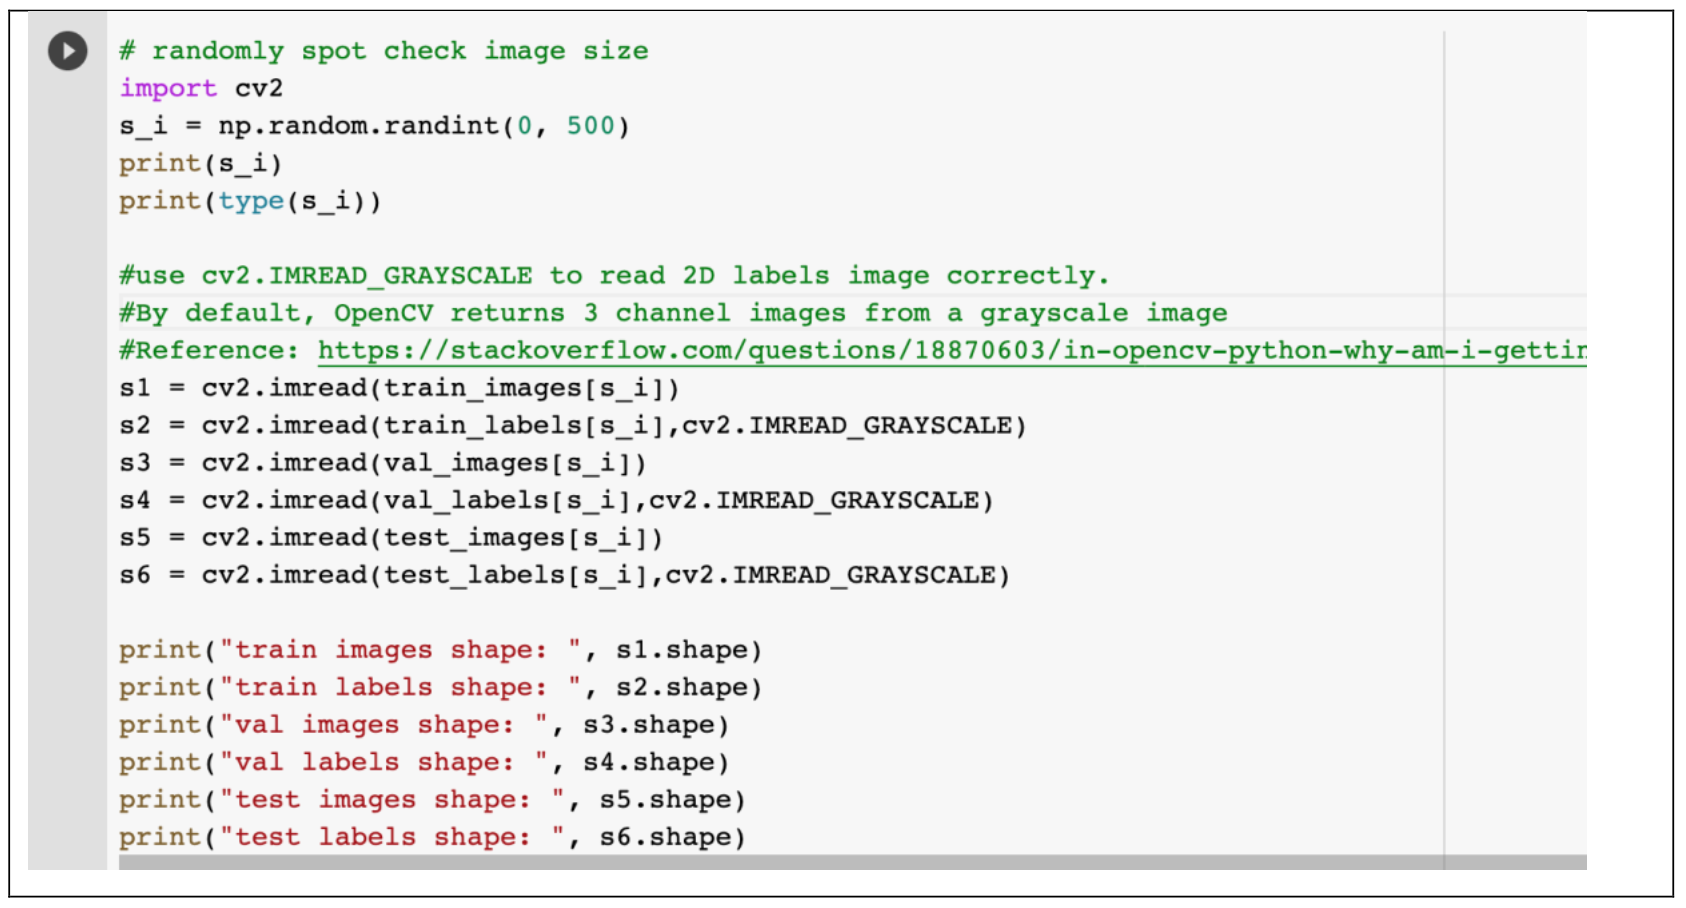
- Participate in the entire Deep Learning Development Cycle using the CityScapes dataset. This procedure consists of data collection, data partitioning, data preprocessing, data exploration, model development, and model performance evaluation.
- Develop segmentation model "U-Net" on the CityScapes dataset with success. I hope that the insights gained during the development of this model will aid autonomous driving companies like Tesla, Waymo, and Baidu Apollo in improving the accuracy of identifying and detecting targets in urban environments.
For the vehicle's computer to make an accurate decision, it must be completely aware of its surroundings and comprehend each pixel in the driving scene [2]. Semantic Segmentation is the assignment of a class label (such as Car, Road, Pedestrian, or Sky) to every pixel in an image [2, 3]. A superior algorithm for semantic segmentation will contribute to the development of autonomous driving.
3.0 CityScapes dataset
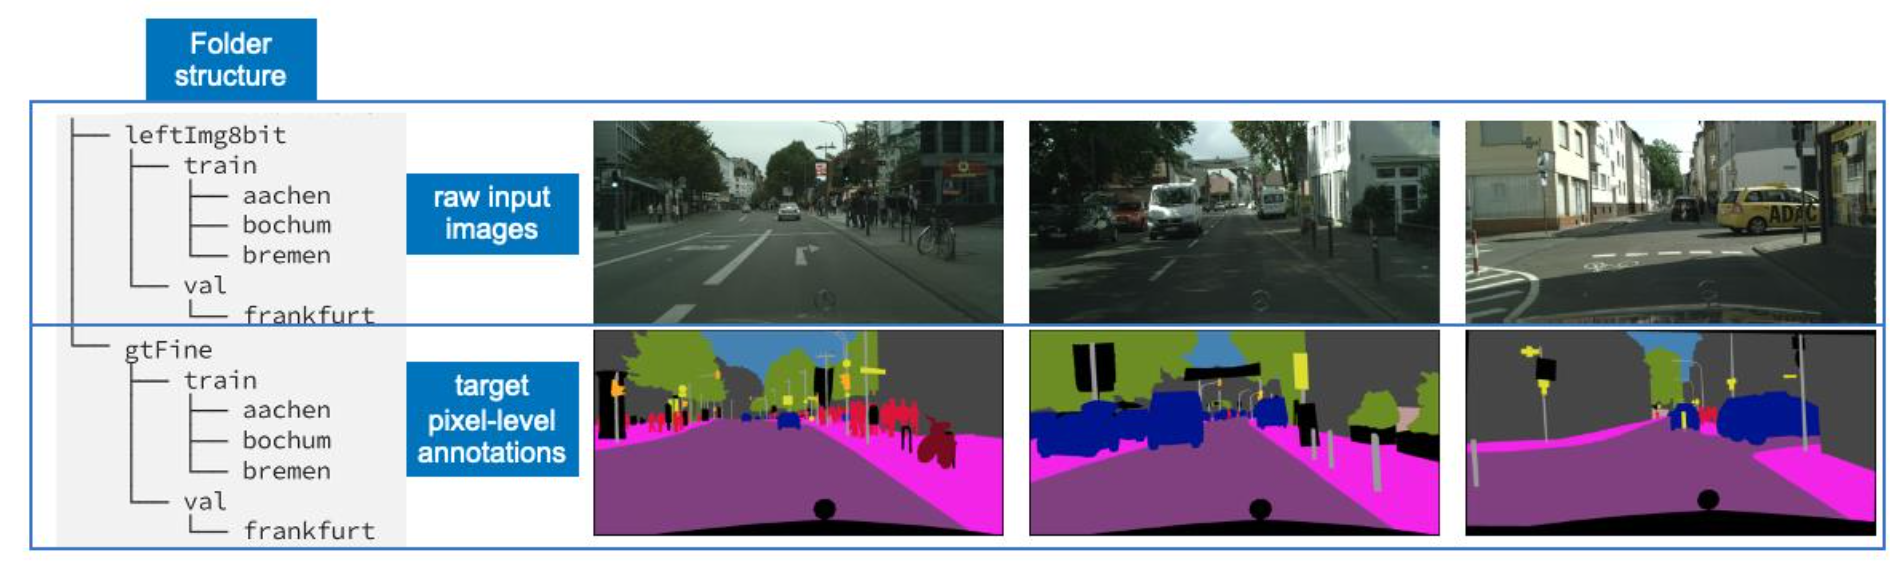
Cityscapes is a large-scale, high-quality dataset for understanding complex urban street scenes semantically. The dataset contains a total of 25,000 2048x1024 RGB-images of urban street scenes from 50 cities in Germany and neighbouring countries [14]. In addition to stereo pairs, computed depth maps (using semi-global matching), and vehicle odometry, each example was captured using the same set of equipment.
The dataset includes the summer, spring, and fall seasons. Negative conditions such as heavy rain and fog are excluded because they necessitate specialised methods and data sets. From 27 cities, 5000 images were hand-selected for dense pixel-level annotation. The remaining 20,000 images from the remaining 23 cities were coarsely annotated in accordance with the policy that the annotator spend no more than seven minutes per image [14]. We ignored the coarsely annotated dataset in our experiments and only used the finely or densely annotated dataset.
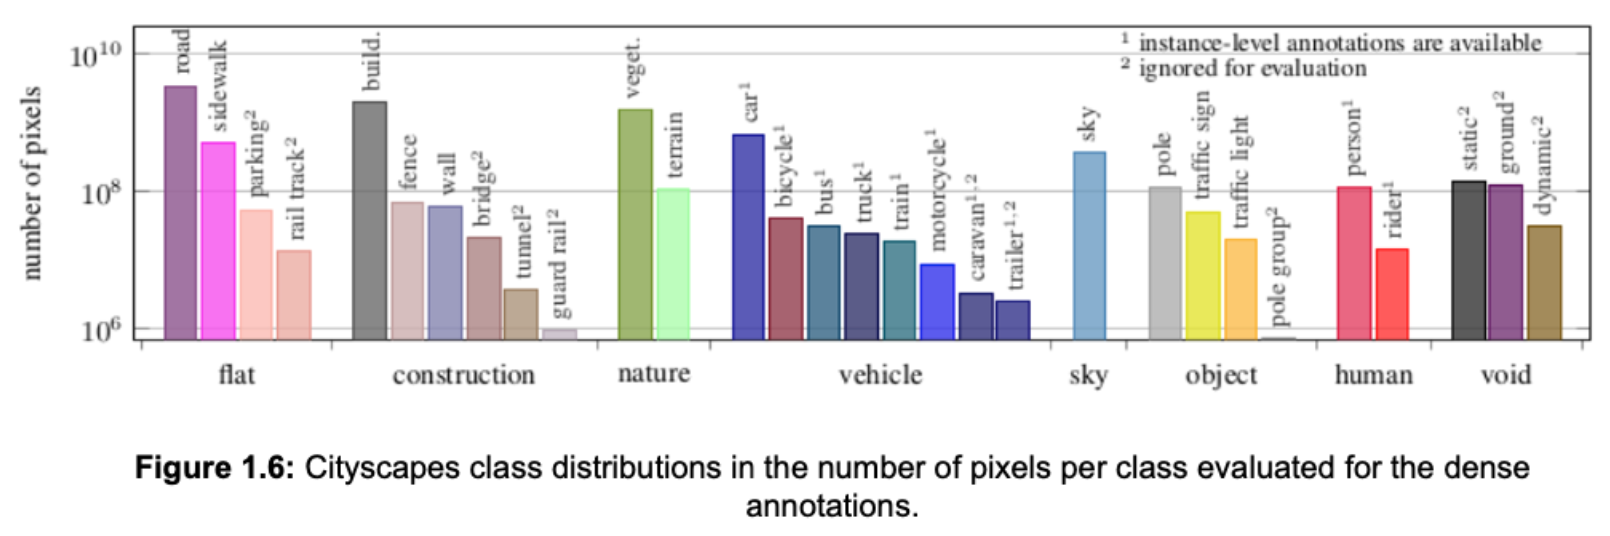
The dataset's authors defined 30 visual classes for annotation, which are grouped into eight categories: flat, construction, nature, vehicle, sky, object, human, and void. Rare classes are excluded from the standard, leaving 19 classes to be evaluated. Figure 1.6 depicts the distribution of imbalanced classes in the Cityscapes dataset.
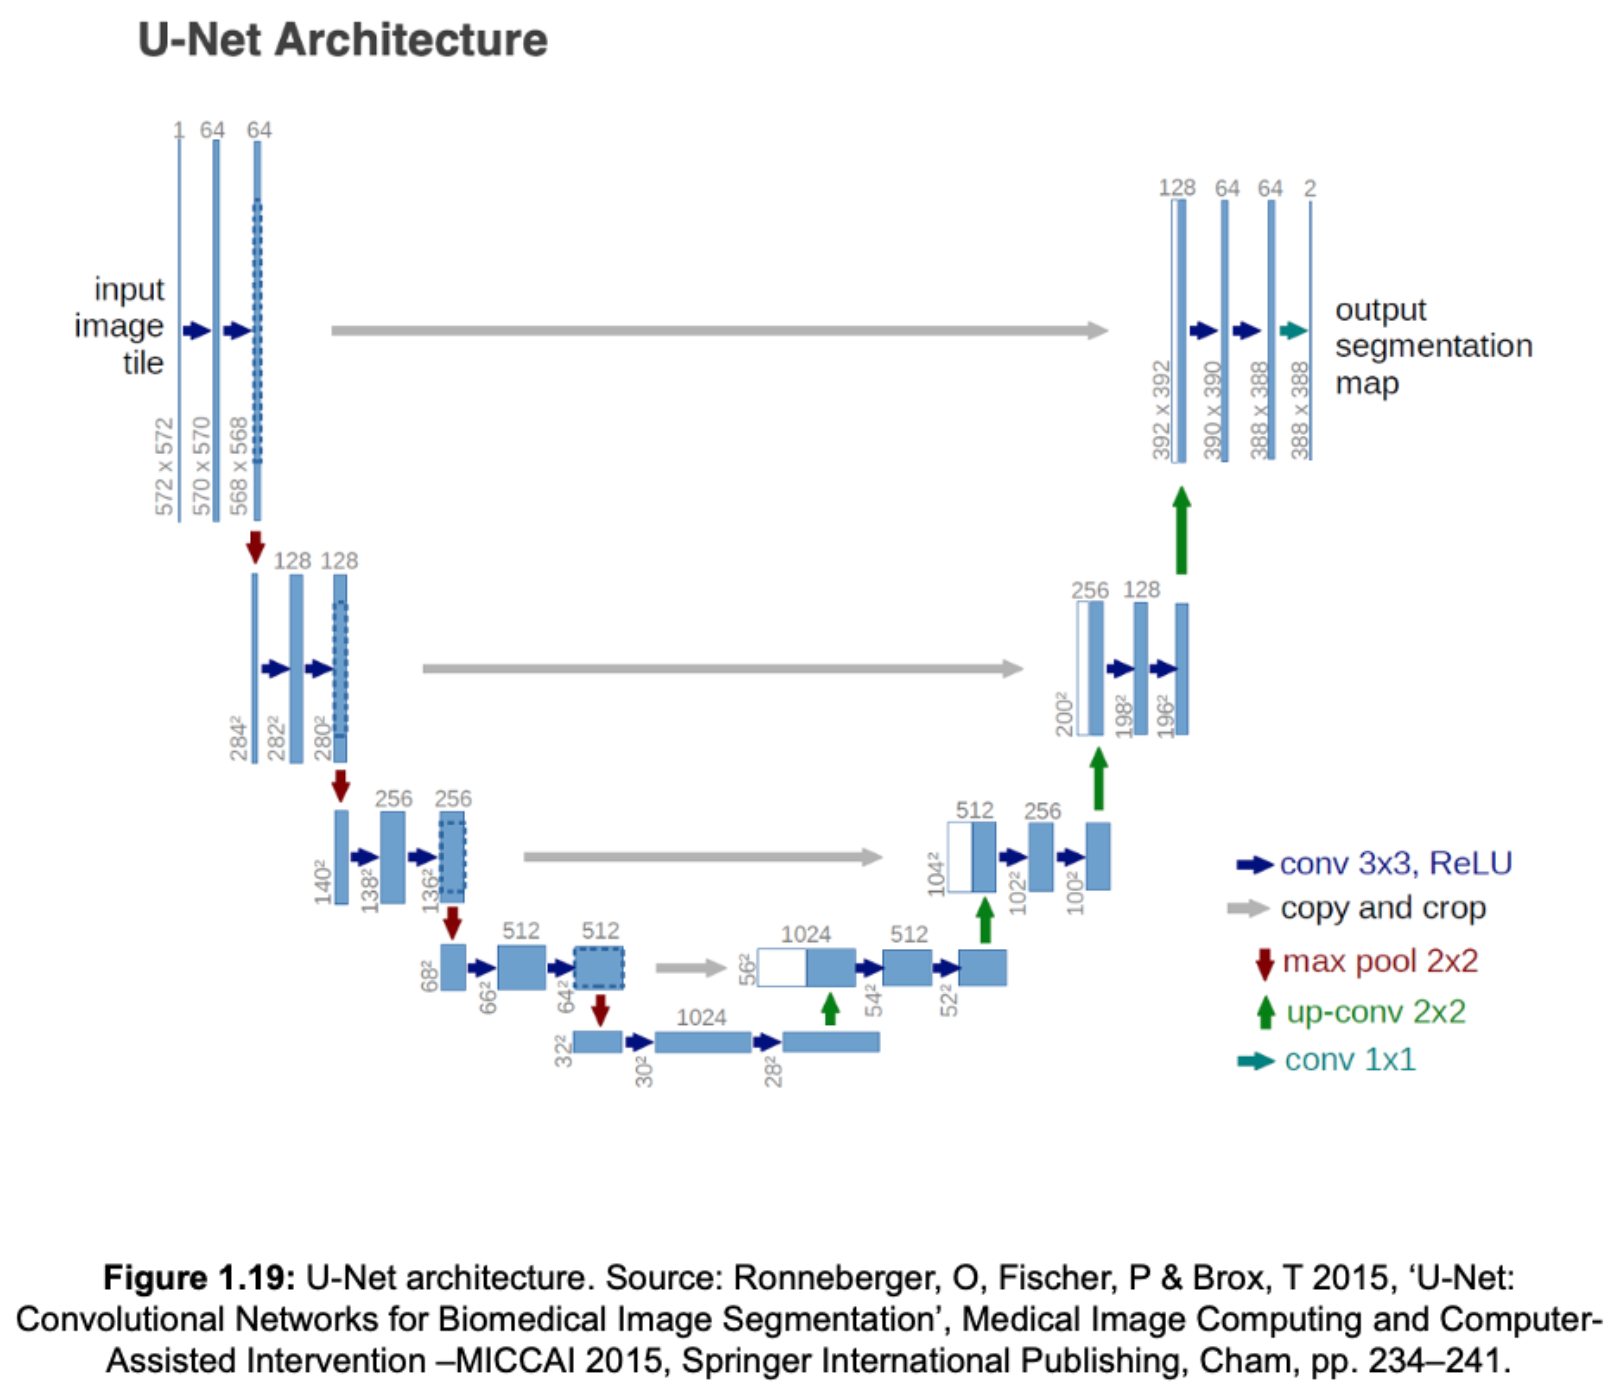
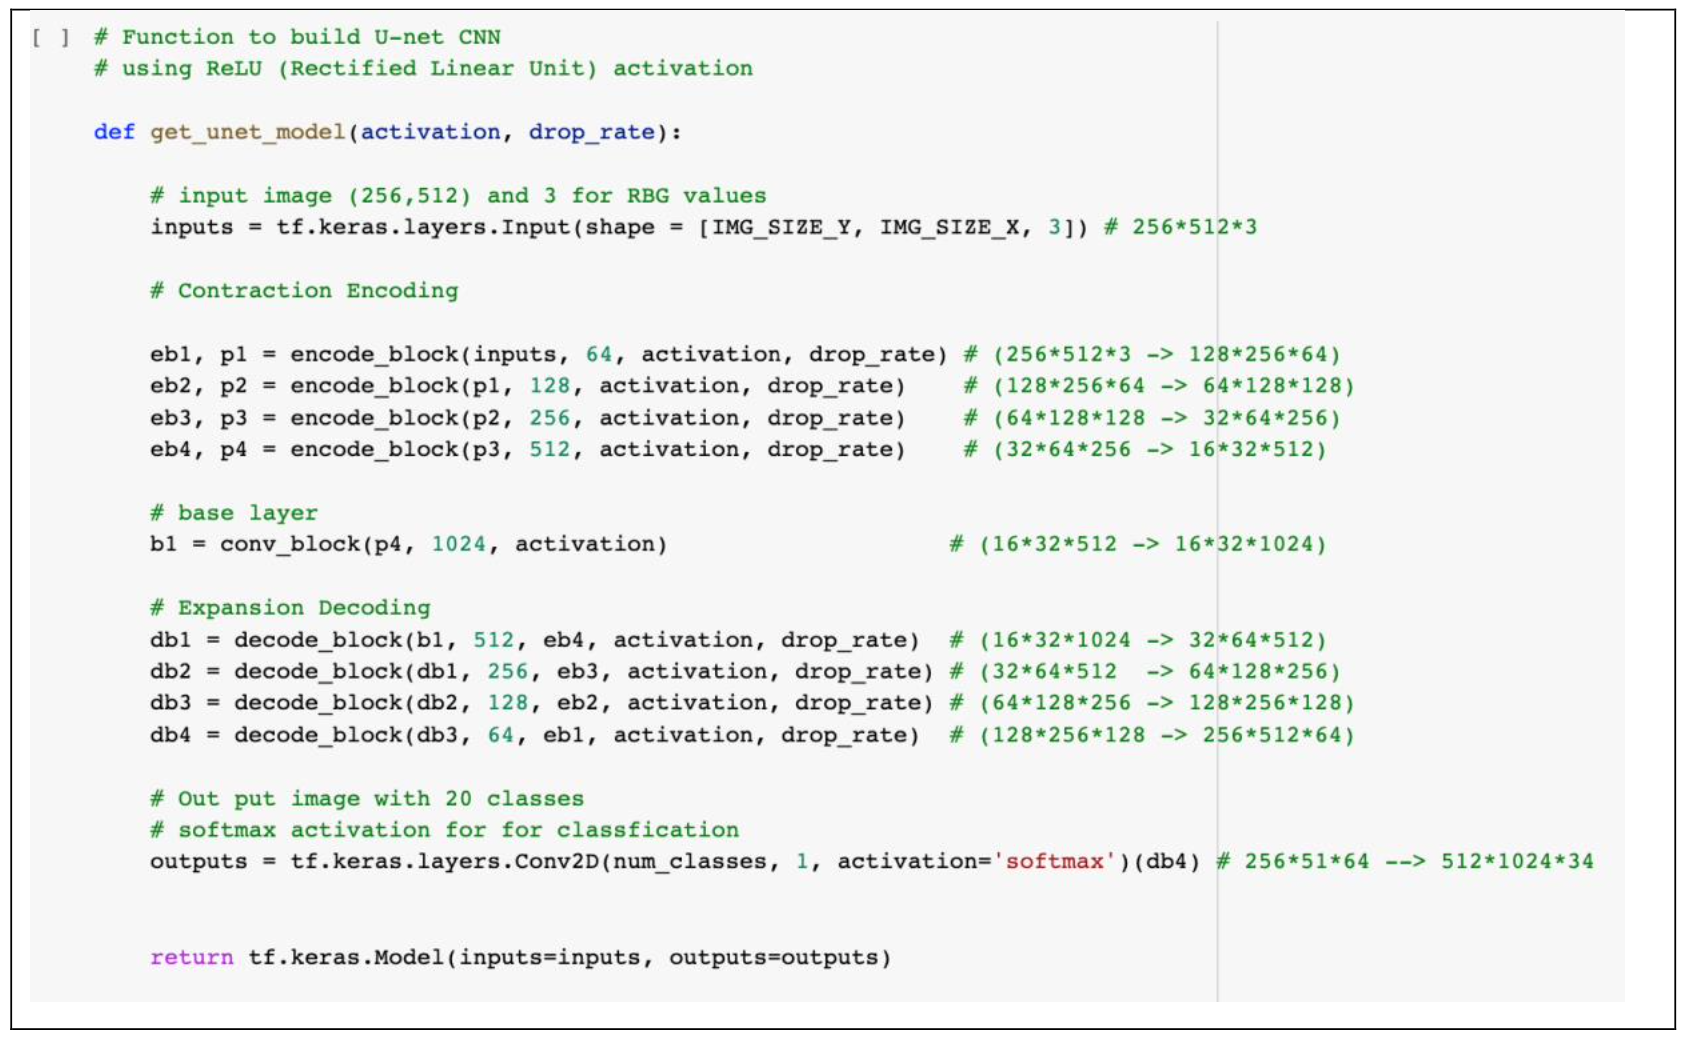
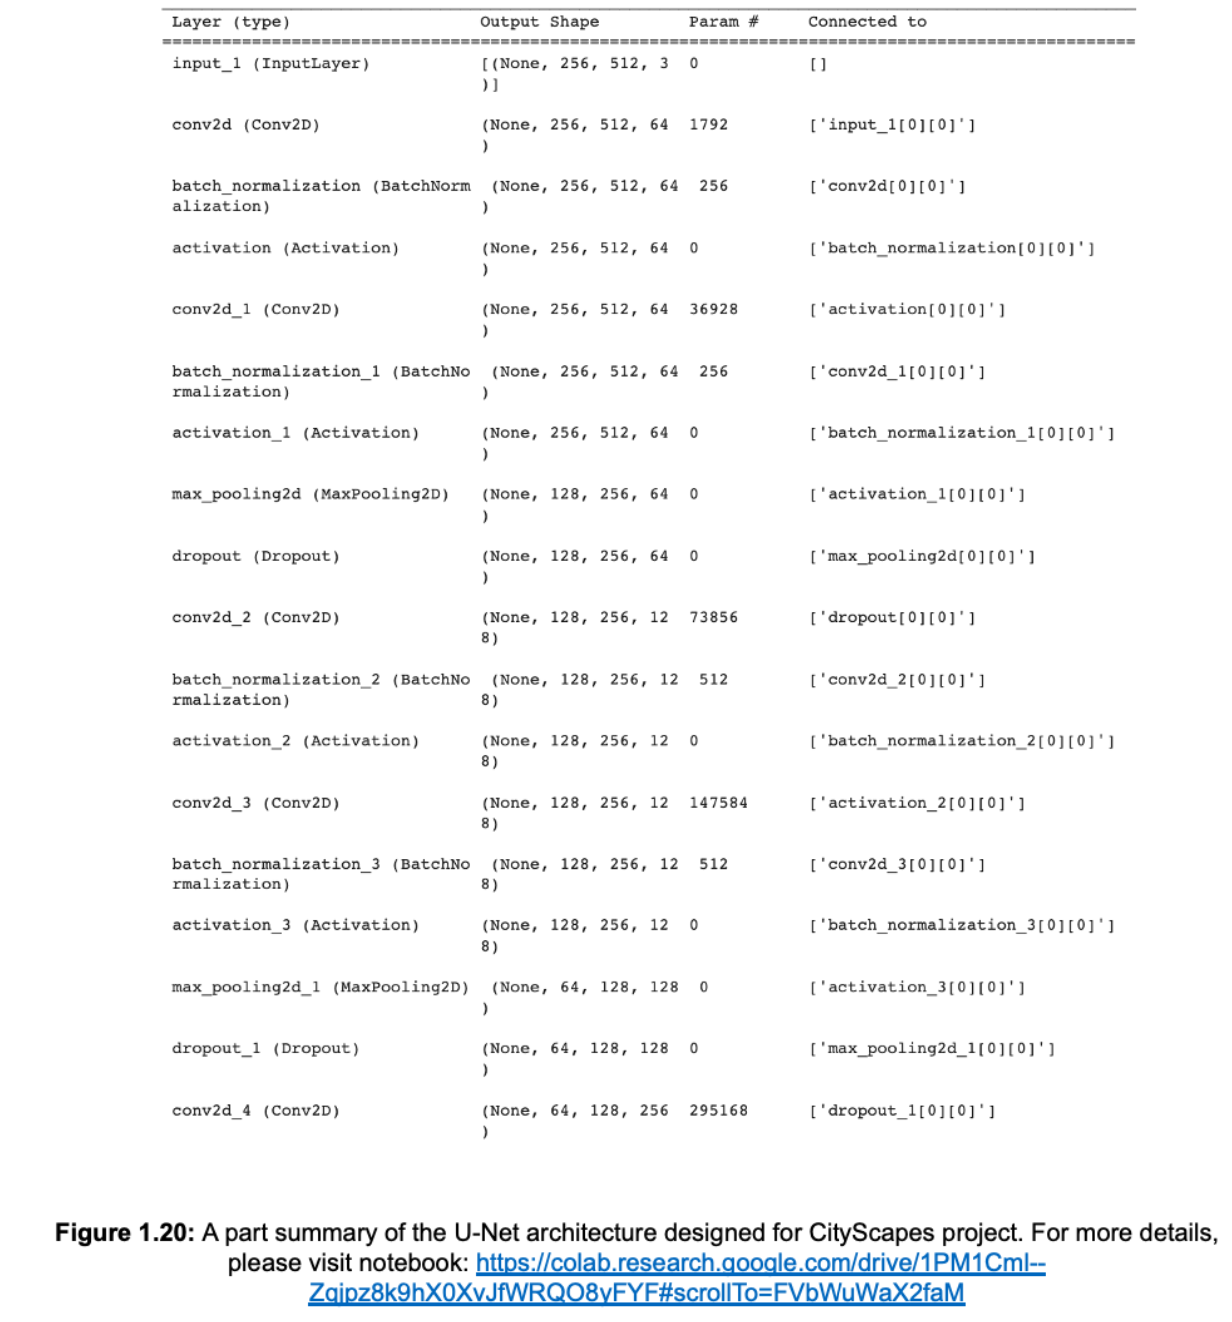
4.0 U-Net Model Development
Fully convolutional networks
5.0 Model Evaluation
5.1 Evaluation Metrics
For measuring the performance of the U-Net model, well-conceived metrics are required. There are numerous methods for measuring prediction outcomes. Pixel Accuracy and Intersection Over Union (IoU) would be the most essential for semantic segmentation (also known as Jaccard Index).
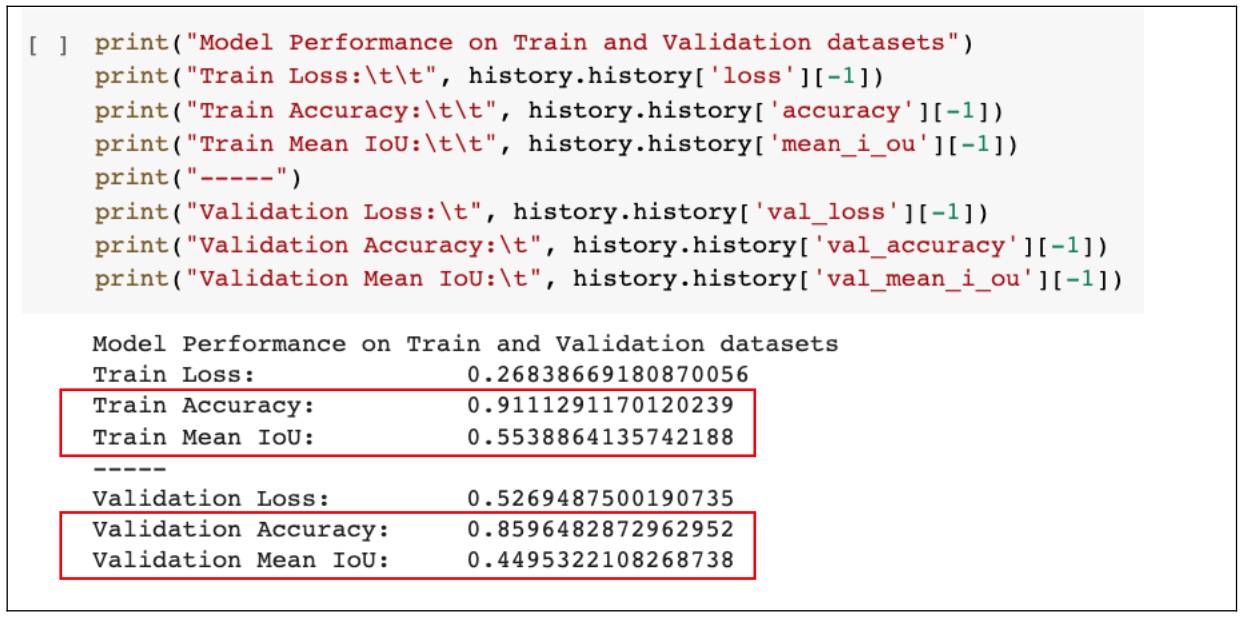
5.2 Performance Evaluation on Train and Val set
Evaluate Accuracy and Mean IoU
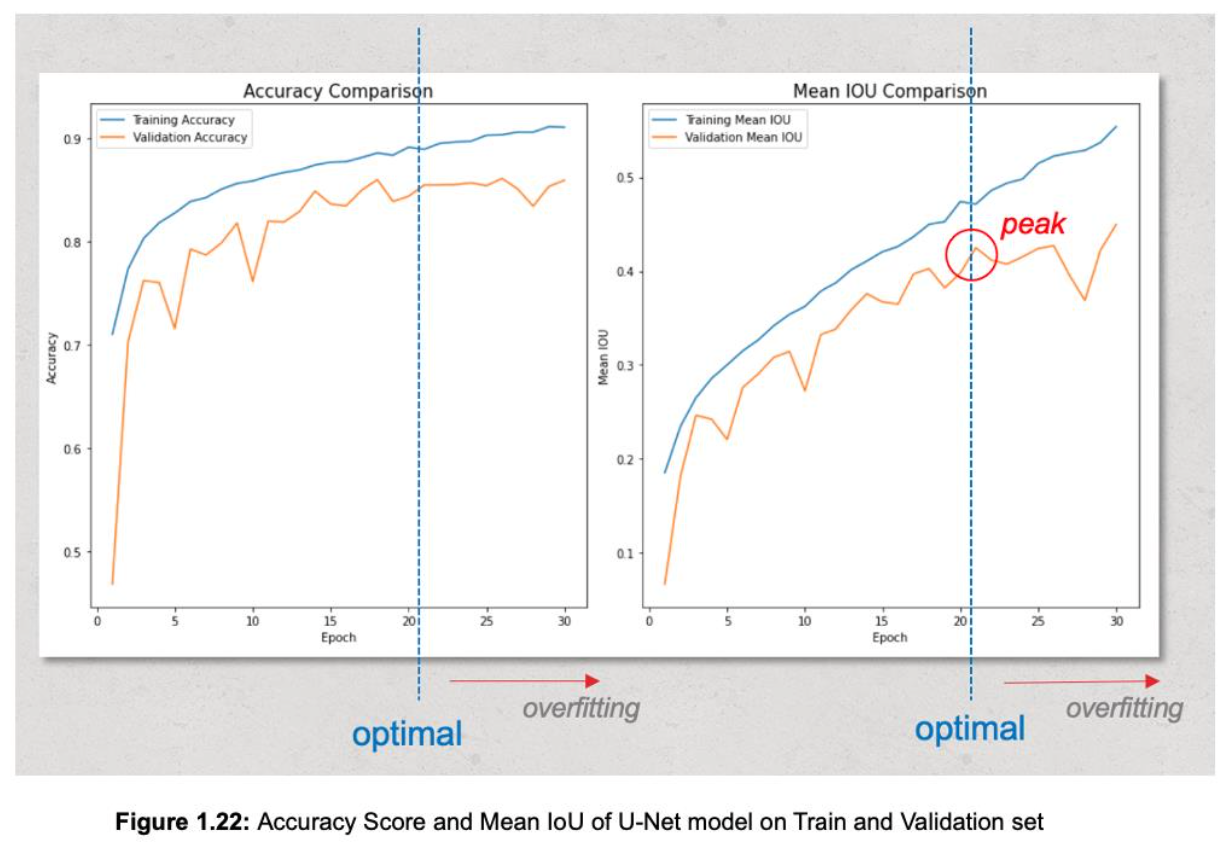
Findings:
- Even though training for 30 epochs, Figure 1.22 shows that the model begins overfitting at epoch 21. From epoch 1 to 21, mean IoU on validation set increases and reaches a peak of 0.4249, however since epoch 21 to 30, mean IoU on validation set decreases while curve of train set consistently increases and peaks at last epoch.
- The same situation happens with accuracy metric.

5.3 Evaluate Loss Function
A loss function gives feedback to the model during the process of supervised training (learning from already-labelled data), how well it is converging upon the optimal model parameters [13].
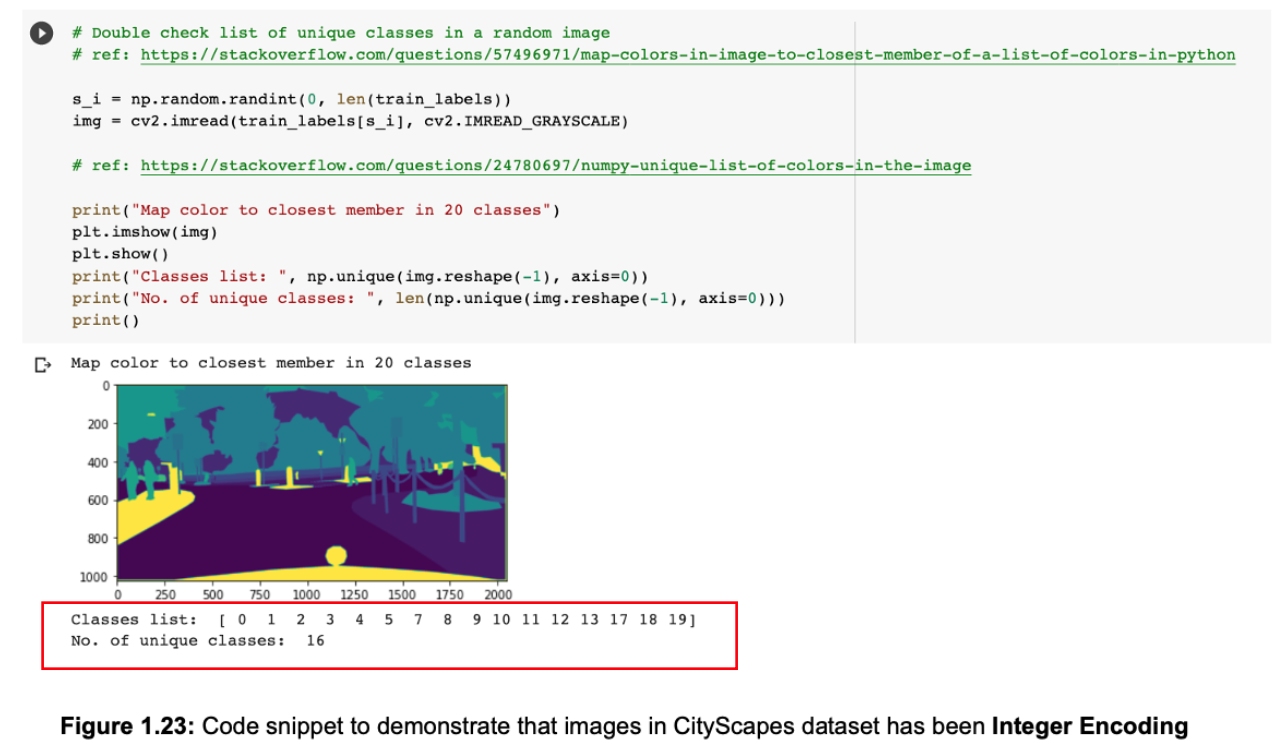
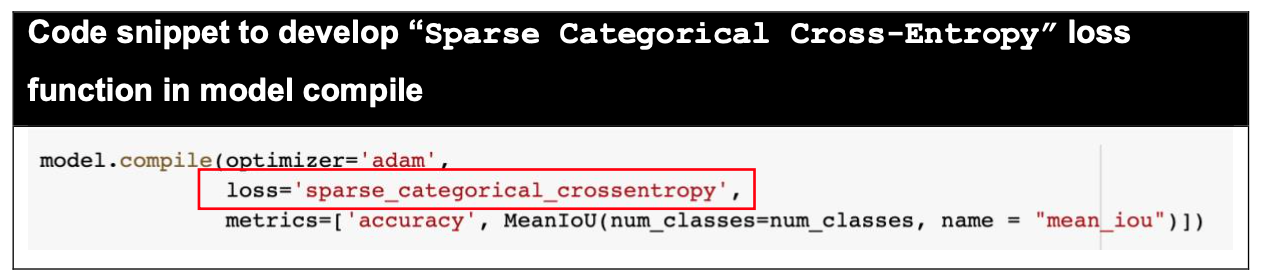
Both "Categorical Cross Entropy" and "Sparse Categorical Cross Entropy" have the same loss function, however in this project we prefer "Sparse Categorical Cross-Entropy" because the truth labels of the Cityscapes dataset are integer encoded (shown in Figure 1.23, not one-hot encoded) during data preparation and pre- processing process.
Findings:
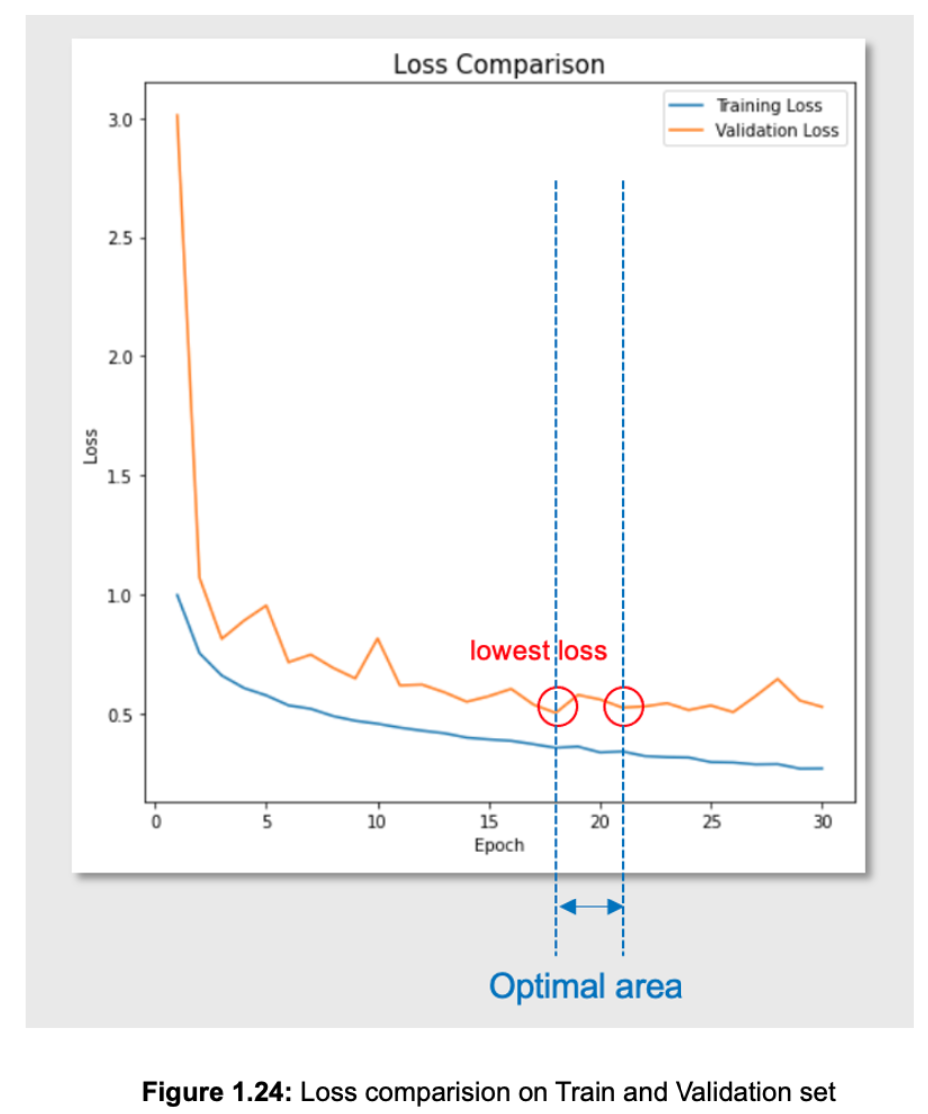
- The validation loss reflected through Figure 1.24 has the lowest loss value of 0.5017 at epoch 18, but if we consider both the peak of mean IoU and accuracy score in above subsection, we can choose epoch 21 (val_loss = 0.5237) as the epoch "ideal" that maps the input data to the output data.
- In conclusion, the parameters at epoch 21 potentially are the optimal parameters that should be used to predict output.